
Brain Mechanism in MCI Patients during Movie-watching Sub-projects 2
Published in University of Electronic Science and Technology of China, Key laboratory for Neuroinformation of Ministry of Education, 2023
EEG Power and Source Analysis in People with MCI during Movie-watching
Introduction
In the same paradigm, we also focus on the changes in EEG power and neural current density induced by MCI.
Results
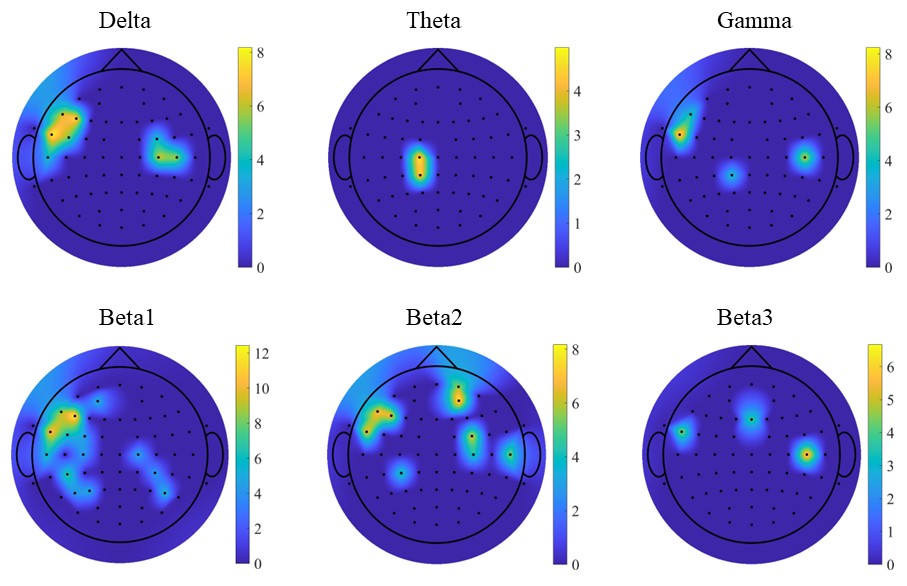
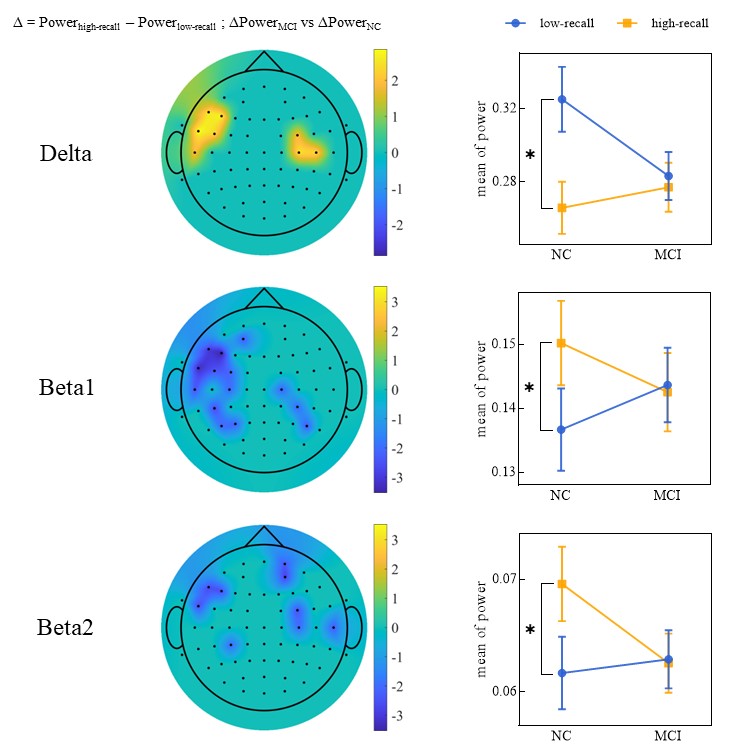
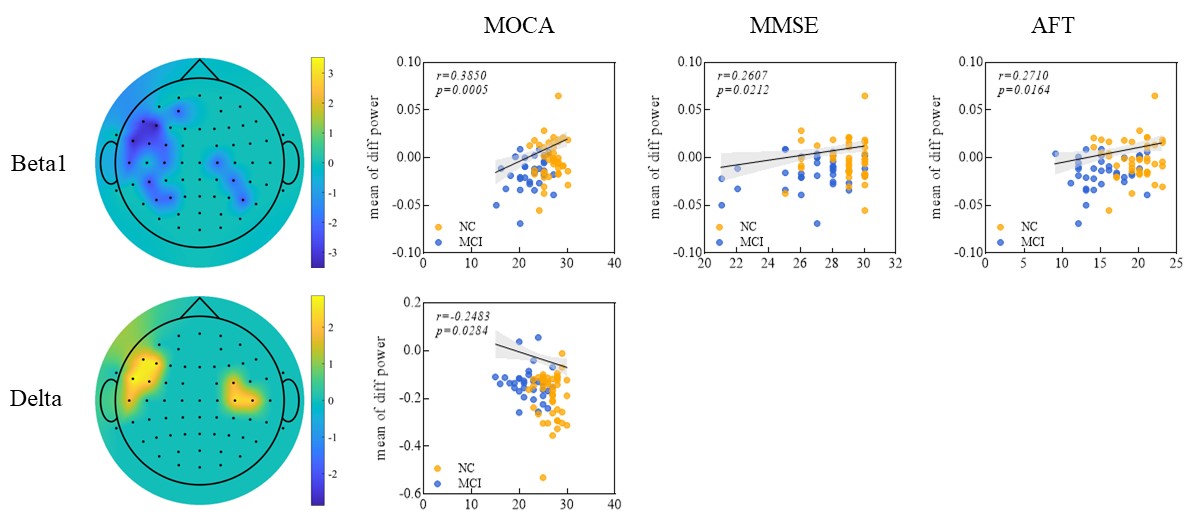
The results are as follows. The main significant results are concentrated in the Delta and Beta bands.
Methods
For each participant, the global normalized EEG power density at the scalp electrode level was evaluated. The relative power in specific band was defined as power of specific band/total power across full band.
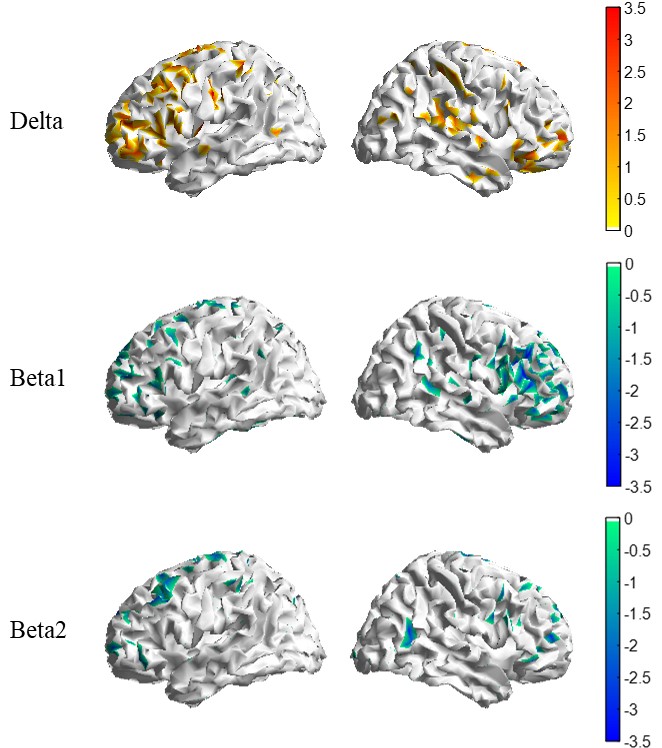
For source analysis, a three-concentric sphere head model according to previous papers was used to generate the leadfield matrix. Then, a geometrically triangular grid based on the standard brain (normalized by the radius of the scalp) were used in the equivalent source model (the mesh was down-sampled to 6144 vertexes to reduce the computational load).
The eLORETA was used to estimate the cortical source activity generating scalp EEG rhythms. The input for this estimation was the EEG spectral power density computed above, and the solutions were computed EEG frequency bin-by-frequency bin .Next, the eLORETA estimates of neural current density were normalized by the following procedure. Source estimates were averaged across all frequency bins from 1 to 40 Hz and 6,144 voxels of the brain model volume, to obtain the eLORETA “mean” neural current density. Afterwards, ratios between any original eLORETA estimate of the neural current density at a given frequency bin/voxel and the eLORETA “mean” neural current density were calculated. And, normalized eLORETA source estimates of each voxel were obtained finally.
It is still analyzed using the same statistical methods as the connectivity. Statistical analyses were separatly performed for power and neural current density.